Temperstack

Practical SRE workflows for incidents, SLOs, automation, and safer releases
Rating
Your vote:
Screenshots
1 / 1
Notify me upon availability

Start by wiring Temperstack into the telemetry you already trust. Connect Prometheus, Datadog, CloudWatch, New Relic, Loki, or OpenTelemetry, and let Temperstack auto-discover services, dependencies, and ownership. Create SLOs for key user journeys, pick the signals (latency, availability, saturation, quality), and set burn-rate windows that fit your on-call model. Map services to teams and on-call rotations (PagerDuty, Opsgenie), define routing rules by severity and business impact, and dry-run alerts to validate noise levels before go-live. In under an hour, you have a live service map, clean alert policies, and clear accountability.

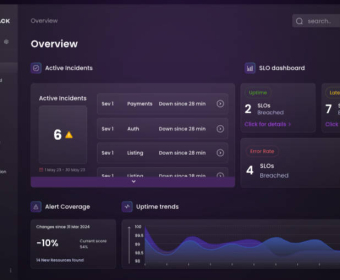
When a page hits, open the incident console to get a single, prioritized feed. Alerts are deduplicated and scored by user impact and error-budget burn, so you focus on what matters first. Each incident shows a timeline that merges metrics, logs, traces, recent deploys, config changes, and upstream/downstream health. Guided triage cards propose ready-to-run queries and checks; pin evidence as you go. With one click, execute a vetted runbook, toggle a feature flag, roll back a canary, flush a cache, or restart a pod—actions are gated by role and logged. Update Slack and the status page directly from the console, spin up a bridge, and file a Jira ticket with context embedded. After stabilization, generate a post-incident report with the full timeline, contributing factors, and follow-ups; owners and due dates sync to your tracker automatically. more

Review summary

Features

  • Plug-and-play integrations with Prometheus, Datadog, CloudWatch, Loki, New Relic, and OpenTelemetry
  • Automatic service graph and dependency mapping
  • SLO and error budget management with burn-rate alerting
  • Alert deduplication, enrichment, and noise reduction
  • Incident console with unified timeline and change correlation
  • Runbooks and safe, role-gated remediation actions
  • Post-incident reports with action item tracking
  • CI/CD gates, canary analysis, and automated rollback
  • Capacity forecasts and autoscaling recommendations
  • Synthetic checks, maintenance windows, and chaos drills
  • RBAC, audit trails, APIs, and Terraform provider
  • Slack, Jira, PagerDuty, and Opsgenie integrations

How It’s Used

  • Onboard a new team: connect data sources, auto-discover services, and set SLOs in under an hour
  • Handle a latency spike: correlate alerts with a recent deploy, roll back, and document in minutes
  • Reduce noise: deduplicate an alert storm and tune policies using built-in suggestions
  • Ship a risky release: run a canary with automatic rollback when golden signals degrade
  • Run a game day: schedule chaos checks, capture evidence, and publish outcomes
  • Prepare a quarterly review: export MTTR/MTTD, uptime, burn rate, and top incident themes
  • Plan for peak traffic: forecast capacity and apply autoscaling guidance with cost context
  • Standardize fixes: publish self-service runbooks for common production issues

Plans & Pricing

Enterprise

Custom

Unlimited Users on Incident Management
Access to SRE experts
All Integrations
Reports
Comments

User

Your vote: